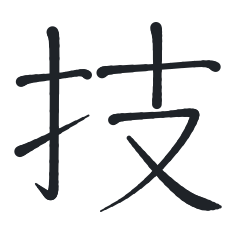
Draw a one-line drawing or a brushed kanji as Desmos equations and as an SVG from the same equations. Examine the render and draw again until it is good. Use for a README drawing, a logo or art in Desmos.
# ddraw

A ddraw drawing is a few confident lines. Each line is a smooth curve through hand-placed
points. Each piece of the curve is one Desmos parametric equation. The same equations make the
SVG. Thus the Desmos file and the picture always agree.

The house style is the one-line drawing after Picasso, and the brushed kanji.

## What makes a drawing good

1. **One idea.** Write the idea in one sentence first. Each line serves that sentence.
2. **Few, long lines.** The subject is one continuous stroke where possible.
3. **One twist.** One surprise that only a drawing can make. One, not three.
4. **Weight shows what matters.** Contour heavy, inner detail medium, hints light. Three
   weights or fewer.
5. **Empty space.** Keep 8% of the canvas empty on each side.
6. **One ink.** An accent colour, if any, goes on one small thing.
7. **Curves, not wobble.** Put points where the curve turns, not along straight parts.
8. **A small signature** in a corner, at the light weight.

## A kanji

- Follow the standard stroke order. Use KanjiVG as a reference only. Draw the points by hand.
  Never copy a KanjiVG path.
- Give each point a brush width. A horizontal stops firmly (*tome*). A falling stroke sweeps
  out to a point (*harai*). A hook lifts at the end (*hane*).
- Write tests: the number of strokes, and the facts of the shape (which stroke crosses which,
  where each stroke ends).

## Steps

1. **Brief.** The idea, the twist, the canvas (240 × 240 for a README drawing), and what is not
   in the drawing.
2. **Compose.** SVG coordinates, y down. Block the big shapes first. Then list the points of
   each stroke, in one direction.
3. **Draw with the pen.** In a repository with `drawings/pen.nix`, write `drawings/<name>.nix`
   as a list of strokes. Each point is `[ x y width ]`. The pen runs a Catmull-Rom spline through
   the points. Each piece is a cubic Bézier and one Desmos expression.
4. **Render and look.** Write the SVG. Render it to PNG with Playwright Chromium. Open the PNG.
   **Never ship a drawing that you did not see.**
5. **Critique and redraw.** Check each rule above against the picture. Move points, remove
   lines, render again. Do three rounds at least. Examine it at README size too.
6. **Write the Desmos file** and run the tests. Each expression read back from its LaTeX must
   stay within 0.01 of its line.
7. **Credit.** Say in `docs/drawings/README.md` what the drawing follows. Mark each claim that
   you could not check with `⚠`.

## Desmos facts

- A graph state is JSON: `{"version": 11, "graph": {"viewport": ...}, "expressions": {"list": [...]}}`.
  Load it on desmos.com/calculator from the console: `Calc.setState(state)`.
- **Desmos has y up and SVG has y down.** A Desmos y is `H - y` of the SVG.
- A cubic Bézier `P0 P1 P2 P3` in power form is `a + bt + ct² + dt³`, with `a = P0`,
  `b = 3(P1 − P0)`, `c = 3(P0 − 2P1 + P2)` and `d = P3 − P0 + 3(P1 − P2)`, for each axis.
- Three decimals are enough.

## The ink

`#1f2328` on light pages and `#e6edf3` on dark pages, through `prefers-color-scheme` in the SVG's
own `<style>`. Round ends. Nothing else.
 h0ffmann/skills